
SNP filtering subset data
SNP filtering
As a first round of filtering for the subset data I followed the SNP filtering tutorial .
The filtration is housed in /home/tejashree/Moorea/ddocent/round1/RefOpt/filtering/.
Step1: Three step filter that keep variants that have been successfully genotyped in 50% of individuals, a minimum quality score of 30, and a minor allele count of 3.
vcftools --vcf TotalRawSNPs.vcf --max-missing 0.5 --mac 3 --minQ 30 --recode --recode-INFO-all --out TotalRawSNPs_g5mac3.vcf
After filtering, kept 20 out of 20 Individuals
Outputting VCF file...
After filtering, kept 129852 out of a possible 495844 Sites
Run Time = 25.00 seconds
Output files include: TotalRawSNPs_g5mac3.vcf.log and TotalRawSNPs_g5mac3.vcf.recode.vcf
Step2: minimum depth for a genotype call and a minimum mean depth
This command will recode genotypes that have less than 3 reads.
vcftools --vcf TotalRawSNPs_g5mac3.vcf.recode.vcf --minDP 3 --recode --recode-INFO-all --out TotalRawSNPs.g5mac3dp3
After filtering, kept 20 out of 20 Individuals
Outputting VCF file...
After filtering, kept 129852 out of a possible 129852 Sites
Run Time = 22.00 seconds
Step3: Missing data
vcftools --vcf TotalRawSNPs.g5mac3dp3.recode.vcf --missing-indv
After filtering, kept 20 out of 20 Individuals
Outputting Individual Missingness
After filtering, kept 129852 out of a possible 129852 Sites
Run Time = 1.00 seconds
Examining the output generated by generating a Histogram of % missing data per individual using the steps outlined in the tutorial.
cat out.imiss
```INDV N_DATA N_GENOTYPES_FILTERED N_MISS F_MISS EOB_175 129852 0 16341 0.125843 EOB_178 129852 0 21945 0.169 EOB_183 129852 0 20706 0.159458 EOB_189 129852 0 14740 0.113514 EOB_192 129852 0 16473 0.12686 PBF_157 129852 0 15395 0.118558 PBF_159 129852 0 50356 0.387795 PBF_165 129852 0 18181 0.140013 PBF_168 129852 0 21080 0.162339 PBF_169 129852 0 17556 0.1352 WOB_38 129852 0 32928 0.253581 WOB_45 129852 0 27633 0.212804 WOB_50 129852 0 19163 0.147576 WOB_62 129852 0 20911 0.161037 WOB_65 129852 0 21456 0.165234 WOF_224 129852 0 16517 0.127199 WOF_232 129852 0 14791 0.113907 WOF_240 129852 0 16258 0.125204 WOF_243 129852 0 15720 0.121061 WOF_244 129852 0 16320 0.125682
Generating a histogram:

Most of the individuals have less than 0.2 missing data.
Create a list of individuals with more than 20% missing data.
`mawk '$5 > 0.2' out.imiss | cut -f1 > lowDP.indv`
Remove individuals with missing data at this cutoff.
`vcftools --vcf TotalRawSNPs.g5mac3dp3.recode.vcf --remove lowDP.indv --recode --recode-INFO-all --out TotalRawSNPs.g5mac3dplm`
```Excluding individuals in 'exclude' list
After filtering, kept 17 out of 20 Individuals
Outputting VCF file...
After filtering, kept 129852 out of a possible 129852 Sites
Run Time = 20.00 seconds
Restrict the data to variants called in a high percentage of individuals and filter by mean depth of genotypes.
vcftools --vcf TotalRawSNPs.g5mac3dplm.recode.vcf --max-missing 0.95 --maf 0.05 --recode --recode-INFO-all --out DP3g95maf05 --min-meanDP 20
This applied a genotype call rate (95%) across all individuals.
```After filtering, kept 17 out of 17 Individuals Outputting VCF file… After filtering, kept 60278 out of a possible 129852 Sites Run Time = 10.00 seconds
This leaves us with about 60278 loci in our filtered vcf file.

### Step4 : filter by a population specific call rate when multiple localities are present
`cat popmap`

```EOB_175 EOB
EOB_178 EOB
EOB_183 EOB
EOB_189 EOB
EOB_192 EOB
PBF_157 PBF
PBF_159 PBF
PBF_165 PBF
PBF_168 PBF
PBF_169 PBF
WOB_38  WOB
WOB_45  WOB
WOB_50  WOB
WOB_62  WOB
WOB_65  WOB
WOF_224 WOF
WOF_232 WOF
WOF_240 WOF
WOF_243 WOF
WOF_244 WOF
Create two lists that have just the individual names for each population.
mawk '$2 == "EOB"' popmap > 1.keep && mawk '$2 == "PBF"' popmap > 2.keep && mawk '$2 == "WOB"' popmap > 3.keep && mawk '$2 == "WOF"' popmap > 4
.keep
Use VCFtools to estimate missing data for loci in each population.
vcftools --vcf DP3g95maf05.recode.vcf --keep 1.keep --missing-site --out 1
```After filtering, kept 5 out of 17 Individuals Outputting Site Missingness After filtering, kept 60278 out of a possible 60278 Sites Run Time = 1.00 seconds
`vcftools --vcf DP3g95maf05.recode.vcf --keep 2.keep --missing-site --out 2`

```After filtering, kept 4 out of 17 Individuals
Outputting Site Missingness
After filtering, kept 60278 out of a possible 60278 Sites
Run Time = 1.00 seconds
vcftools --vcf DP3g95maf05.recode.vcf --keep 3.keep --missing-site --out 3
```After filtering, kept 3 out of 17 Individuals Outputting Site Missingness After filtering, kept 60278 out of a possible 60278 Sites Run Time = 1.00 seconds
`vcftools --vcf DP3g95maf05.recode.vcf --keep 4.keep --missing-site --out 4`

```After filtering, kept 5 out of 17 Individuals
Outputting Site Missingness
After filtering, kept 60278 out of a possible 60278 Sites
Run Time = 1.00 seconds
This will generate files named 1.lmiss and 2.lmiss. We can combine the two files and make a list of loci about the threshold of 10% missing data to remove.
cat 1.lmiss 2.lmiss 3.lmiss 4.lmiss | mawk '!/CHR/' | mawk '$6 > 0.1' | cut -f1,2 >> badloci
That yielded no bad loci.
Used it in the step anyways.
vcftools --vcf DP3g95maf05.recode.vcf --exclude-positions badloci --recode --recode-INFO-all --out DP3g95p5maf05
```After filtering, kept 17 out of 17 Individuals Outputting VCF file… After filtering, kept 60278 out of a possible 60278 Sites Run Time = 7.00 seconds
### Step5: Allele balance
Because RADseq targets specific locations of the genome, we expect that the allele balance in our data (for real loci) should be close to 0.5.

`vcffilter -s -f "AB > 0.25 & AB < 0.75 | AB < 0.01" DP3g95p5maf05.recode.vcf > DP3g95p5maf05.fil1.vcf`

vcffilter works with simple conditional statements, so this filters out loci with an allele balance below 0.25 and above 0.75. However, it does include those that are close to zero. The last condition is to catch loci that are fixed variants (all individuals are homozygous for one of the two variants).

To see how many loci are now in the VCF file, you could feed it into VCFtools or you can just use a simple mawk statement:

`mawk '!/#/' DP3g95p5maf05.recode.vcf | wc -l`
`60278`

`mawk '!/#/' DP3g95p5maf05.fil1.vcf | wc -l`
`50639`

### Filter out sites that have reads from both strands

`vcffilter -f "SAF / SAR > 100 & SRF / SRR > 100 | SAR / SAF > 100 & SRR / SRF > 100" -s DP3g95p5maf05.fil1.vcf > DP3g95p5maf05.fil2.vcf`

Count again..
`mawk '!/#/' DP3g95p5maf05.fil2.vcf | wc -l`
`43998`

### Ratio of mapping qualities between reference and alternate alleles

`vcffilter -f "MQM / MQMR > 0.9 & MQM / MQMR < 1.05" DP3g95p5maf05.fil2.vcf > DP3g95p5maf05.fil3.vcf`

`mawk '!/#/' DP3g95p5maf05.fil3.vcf | wc -l`
`43150`

### Discrepancy in the properly paired status of for reads supporting reference or alternate alleles

`vcffilter -f "PAIRED > 0.05 & PAIREDR > 0.05 & PAIREDR / PAIRED < 1.75 & PAIREDR / PAIRED > 0.25 | PAIRED < 0.05 & PAIREDR < 0.05" -s DP3g95p5maf05.fil3.vcf > DP3g95p5maf05.fil4.vcf`
`mawk '!/#/' DP3g95p5maf05.fil4.vcf | wc -l`
`42495`

### removing any locus that has a quality score below 1/4 of the depth

`vcffilter -f "QUAL / DP > 0.25" DP3g95p5maf05.fil4.vcf > DP3g95p5maf05.fil5.vcf`

Create a list of the depth of each locus.

`cut -f8 DP3g95p5maf05.fil5.vcf | grep -oe "DP=[0-9]*" | sed -s 's/DP=//g' > DP3g95p5maf05.fil5.DEPTH`

The second step is to create a list of quality scores.

`mawk '!/#/' DP3g95p5maf05.fil5.vcf | cut -f1,2,6 > DP3g95p5maf05.fil5.vcf.loci.qual`
Calculate mean depth

Next step is to calculate the mean depth.

`mawk '{ sum += $1; n++ } END { if (n > 0) print sum / n; }' DP3g95p5maf05.fil5.DEPTH`
`1861.2`

Now the the mean plus 3X the square of the mean.

`python -c "print int(1861+3*(1861**0.5))"`

`1990`

Next we paste the depth and quality files together and find the loci above the cutoff that do not have quality scores 2 times the depth.

`paste DP3g95p5maf05.fil5.vcf.loci.qual DP3g95p5maf05.fil5.DEPTH | mawk -v x=1990 '$4 > x' | mawk '$3 < 2 * $4' > DP3g95p5maf05.fil5.lowQDloci`

Now we can remove those sites and recalculate the depth across loci with VCFtools.

`vcftools --vcf DP3g95p5maf05.fil5.vcf --site-depth --exclude-positions DP3g95p5maf05.fil5.lowQDloci --out DP3g95p5maf05.fil5`

```After filtering, kept 17 out of 17 Individuals
Outputting Depth for Each Site
After filtering, kept 40430 out of a possible 42460 Sites
Run Time = 1.00 seconds
Now let’s take VCFtools output and cut it to only the depth scores.
cut -f3 DP3g95p5maf05.fil5.ldepth > DP3g95p5maf05.fil5.site.depth
Now let’s calculate the average depth by dividing the above file by the number of individuals 17.
mawk '!/D/' DP3g95p5maf05.fil5.site.depth | mawk -v x=17 '{print $1/x}' > meandepthpersite
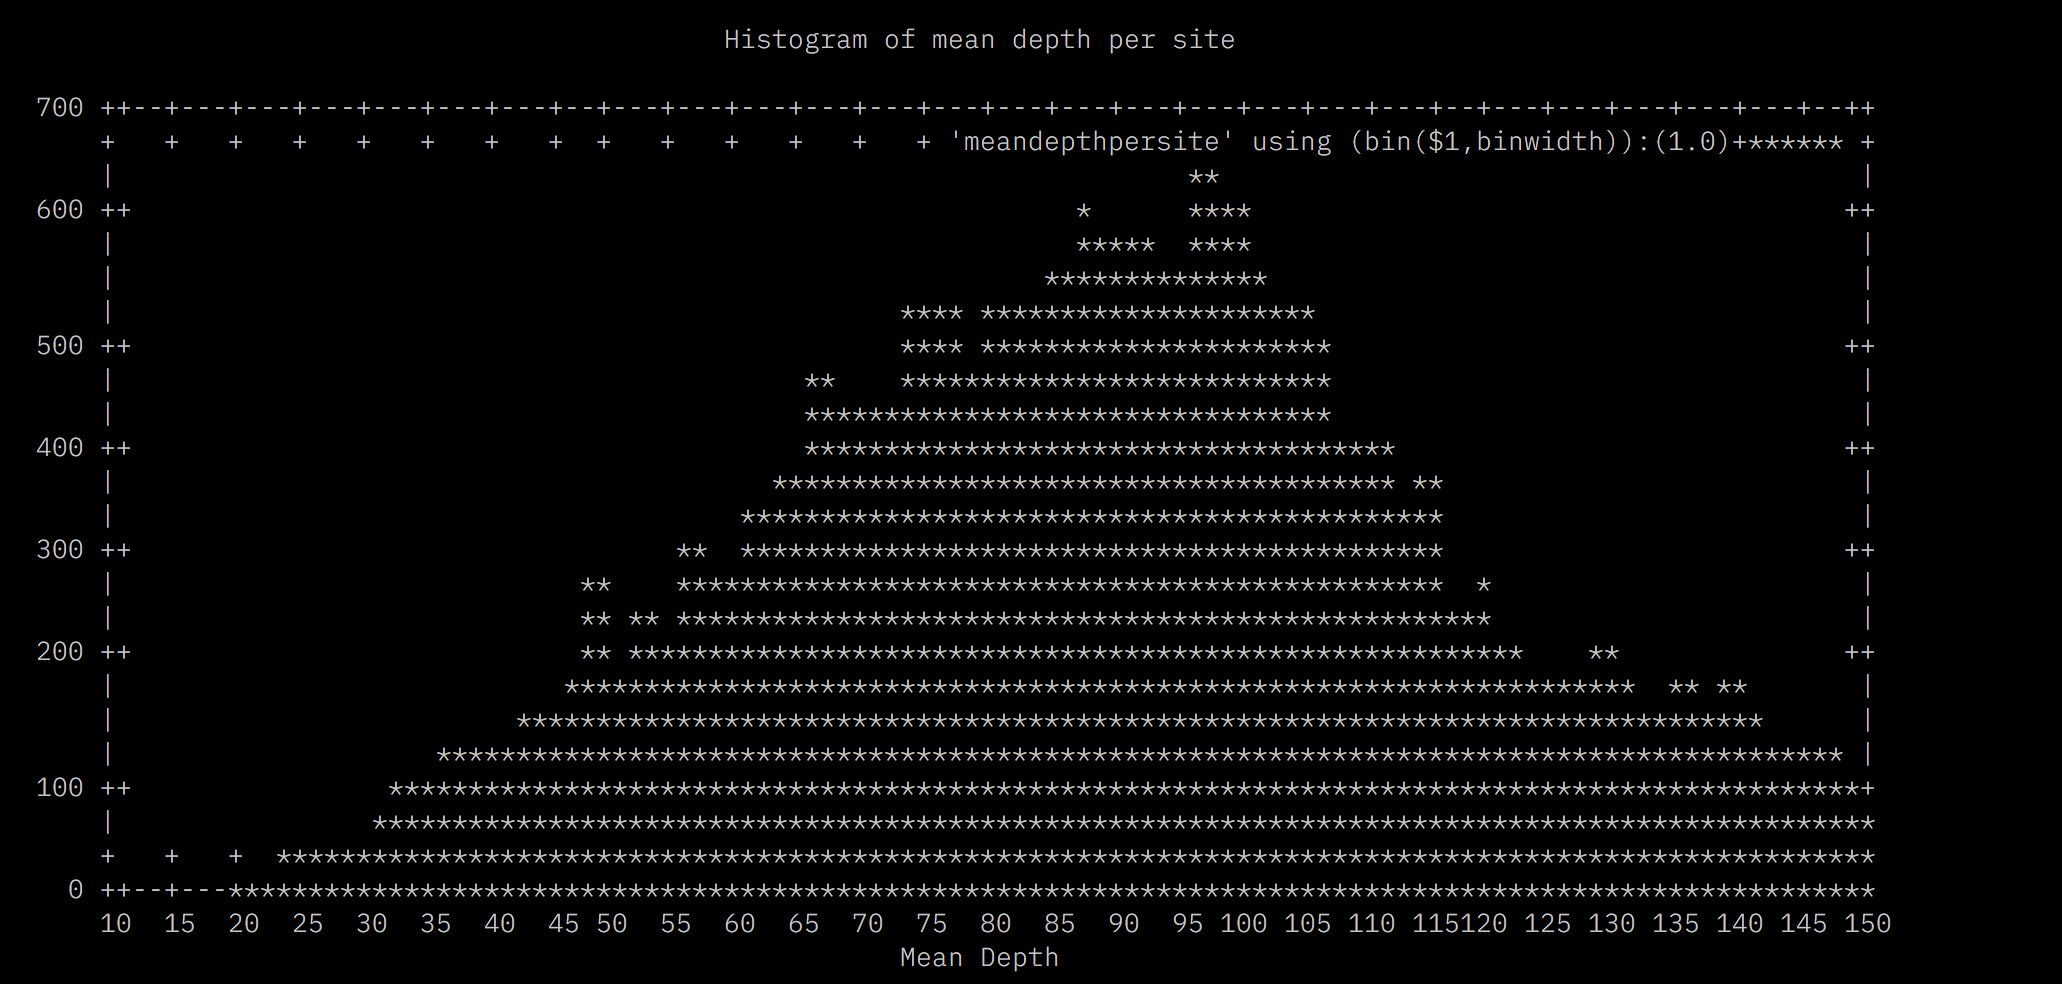
Loci that have high mean depth are indicative of either paralogs or multicopy loci. Either way we want to remove them. Here, I’d remove all loci above a mean depth of 102.5. Now we can combine both filters to produce another VCF file.
vcftools --vcf DP3g95p5maf05.fil5.vcf --recode-INFO-all --out DP3g95p5maf05.FIL --max-meanDP 102.5 --exclude-positions DP3g95p5maf05.fil5.lowQDloci --recode
```After filtering, kept 17 out of 17 Individuals Outputting VCF file… After filtering, kept 25255 out of a possible 42460 Sites Run Time = 4.00 seconds`
### Step6: HWE filter
Let’s filter our SNPs by population specific HWE First, we need to convert our variant calls to SNPs To do this we will use another command from vcflib called vcfallelicprimatives.

`vcfallelicprimitives DP3g95p5maf05.FIL.recode.vcf --keep-info --keep-geno > DP3g95p5maf05.prim.vcf`

This will decompose complex variant calls into phased SNP and INDEL genotypes and keep the INFO flags for loci and genotypes. Next, we can feed this VCF file into VCFtools to remove indels.

` vcftools --vcf DP3g95p5maf05.prim.vcf --remove-indels --recode --recode-INFO-all --out SNP.DP3g95p5maf05 `

```After filtering, kept 17 out of 17 Individuals
Outputting VCF file...
After filtering, kept 26856 out of a possible 28352 Sites
Run Time = 3.00 seconds`
We now have 26856 SNP calls in our new VCF. `
Now, let’s apply the HWE filter.
./filter_hwe_by_pop.pl -v SNP.DP3g95p5maf05.recode.vcf -p popmap -o SNP.DP3g95p5maf05.HWE -h 0.01
``` Processing population: EOB (5 inds)
Processing population: PBF (5 inds)
Processing population: WOB (5 inds)
Processing population: WOF (5 inds)
Outputting results of HWE test for filtered loci to ‘filtered.hwe’
Kept 26856 of a possible 26856 loci (filtered 0 loci) `
We have now created a thoroughly filtered VCF, and we should have confidence in these SNP calls.

### Checking for errors

` ./ErrorCount.sh SNP.DP3g95p5maf05.HWE.recode.vcf `

``` This script counts the number of potential genotyping errors due to low read depth
It report a low range, based on a 50% binomial probability of observing the second allele in a heterozygote and a high range based on a 25% probability.
Potential genotyping errors from genotypes from only 1 read range from 0.0 to 0.0
Potential genotyping errors from genotypes from only 2 reads range from 0.0 to 0.0
Potential genotyping errors from genotypes from only 3 reads range from 116.0 to 389.76
Potential genotyping errors from genotypes from only 4 reads range from 67.8125 to 342.86
Potential genotyping errors from genotypes from only 5 reads range from 41.59375 to 315
17 number of individuals and 26856 equals 456552 total genotypes
Total genotypes not counting missing data 456552
Total potential error rate is between 0.000493714297604654 and 0.002294634565175489
SCORCHED EARTH SCENARIO
WHAT IF ALL LOW DEPTH HOMOZYGOTE GENOTYPES ARE ERRORS?????
The total SCORCHED EARTH error rate is 0.007324466873433914. `
SNP filtering summary
| Step | Filtering step | SNPs retained | Indiv retained |
|---|---|---|---|
| 0 | Began with | 495844 | 20 |
| 1 | 50% of individuals, a minimum quality score of 30, and a minor allele count of 3 | 129852 | 20 |
| 2 | minimum mean depth | 129852 | 20 |
| 3 | Missing data | 129852 | 20 |
| 4 | Remove individuals with missing data at 20% cutoff | 129852 | 17 |
| 5 | variants called in a high percentage of individuals (95%) and filter by mean depth of genotypes | 60278 | 17 |
| 6 | filter by a population specific call rate when multiple localities are present | 60278 | 17 |
| 7 | Allele balance | 50639 | 17 |
| 8 | Filter out sites that have reads from both strands | 43998 | 17 |
| 9 | mapping qualities between reference and alternate alleles | 43150 | 17 |
| 10 | properly paired status of reads | 42495 | 17 |
| 11 | removing any locus that has a quality score below 1/4 of the depth | 42460 | 17 |
| 12 | find the loci above the cutoff that do not have quality scores 2 times the depth | 40430 | 17 |
| 13 | HWE | 26856 | 17 |