Comparison of ddARD data analysis results for sample subgroups
A. Comparison of results for subgroups of samples identified from DAPC analysis of full dataset
Using find.clusters from package adgenet on full ddRAD data set identified 5 clusters:
#### DAPC ####
> grps <- find.clusters(SNPs) #45 PCs and k=5 clusters
Choose the number PCs to retain (>= 1):
45
Choose the number of clusters (>=2:
5
> grps$grp
EOB_174_ddr EOB_175_ddr EOB_176_ddr EOB_177_ddr EOB_178_ddr EOB_182_ddr EOB_183_ddr EOB_184_ddr EOB_185_ddr
          1           1           4           2           2           2           2           2           1
EOB_186_ddr EOB_188_ddr EOB_189_ddr EOB_190_ddr EOB_191_ddr EOB_192_ddr EOB_492_ddr EOB_493_ddr EOB_494_ddr
          2           2           1           1           2           1           4           4           4
PBF_157_ddr PBF_158_ddr PBF_160_ddr PBF_161_ddr PBF_164_ddr PBF_165_ddr PBF_167_ddr PBF_168_ddr PBF_169_ddr
          3           1           2           1           1           5           5           5           1
PBF_171_ddr PBF_172_ddr PBF_489_ddr PBF_490_ddr PBF_491_ddr  WOB_35_ddr  WOB_41_ddr  WOB_42_ddr  WOB_45_ddr
          1           1           3           3           3           1           2           2           2
 WOB_47_ddr  WOB_48_ddr  WOB_49_ddr  WOB_50_ddr  WOB_59_ddr  WOB_60_ddr  WOB_62_ddr  WOB_65_ddr WOF_217_ddr
          2           2           2           2           2           2           2           2           5
WOF_224_ddr WOF_225_ddr WOF_232_ddr WOF_234_ddr WOF_236_ddr WOF_237_ddr WOF_238_ddr WOF_239_ddr WOF_240_ddr
          1           1           1           1           1           1           1           1           1
WOF_241_ddr WOF_243_ddr WOF_244_ddr WOF_245_ddr
          1           1           1           1
Levels: 1 2 3 4 5
Following is the membership of the clusters identified of sizes 26, 20, 4, 4, 4:
- EOB_174,EOB_175,EOB_185,EOB_189,EOB_190,EOB_192,PBF_158,PBF_161,PBF_164,PBF_169,PBF_171,PBF_172,WOB_35,WOF_224,WOF_225, WOF_232, WOF_234, WOF_236,WOF_237,WOF_238,WOF_239,WOF_240,WOF_241,WOF_243,WOF_244,WOF_245.
- EOB_177,EOB_178,EOB_182,EOB_183,EOB_184,EOB_186,EOB_188,EOB_191,PBF_160,WOB_41,WOB_42,WOB_45,WOB_47,WOB_48,WOB_49,WOB_50,WOB_59,WOB_60,WOB_62,WOB_65
- PBF_157,PBF_489, PBF_490, PBF_491
- EOB_176,EOB_492,EOB_493,EOB_494
- PBF_165, PBF_167, PBF_168,WOF_217
The dapc plot shows:
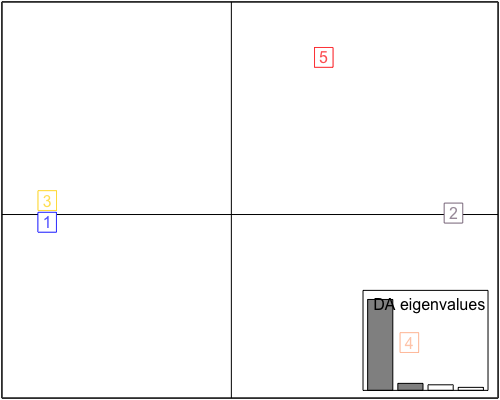
This shows cluster 1 & 3 close together so this was decided as a single subgroup for testing. Subgroup1 with 26+4=30 individuals and subgroup2 with 20 individuals. Their membership shown below:
- Subgroup1 (30): EOB_174,EOB_175,EOB_185,EOB_189,EOB_190,EOB_192, PBF_157,PBF_158,PBF_161,PBF_164,PBF_169,PBF_171,PBF_172,PBF_489,PBF_490,PBF_491, WOB_35, WOF_224,WOF_225,WOF_232, WOF_234,WOF_236,WOF_237,WOF_238,WOF_239,WOF_240,WOF_241,WOF_243,WOF_244,WOF_245.
- Subgroup2 (20): EOB_177,EOB_178,EOB_182,EOB_183,EOB_184,EOB_186,EOB_188,EOB_191, PBF_160, WOB_41,WOB_42,WOB_45,WOB_47,WOB_48,WOB_49,WOB_50,WOB_59,WOB_60,WOB_62,WOB_65.
Conclusion on subset and subgroups of data
- Subgroup1: PCA and MDS for subgroup1 (that was cluster1+3 as identified by dapc) shows 4 clusters:
- PBF 164, WOF 236
- PBF 157, PBF 489, PBF 490, PBF 491 (which was cluster3 per dapc)
- PBF 158, EOB 174
- EOB_175,EOB_185,EOB_189,EOB_190,EOB_192,PBF_161,PBF_169,PBF_171,PBF_172,WOB_35,WOF_224,WOF_225, WOF_232, WOF_234,WOF_237,WOF_238,WOF_239,WOF_240,WOF_241,WOF_243,WOF_244,WOF_245.
- Subgroup2: All the samples are from the back reef (EOB/WOB) except PBF 160. To keep the comparison between east vs west back fringe sample PBF160 will be removed from this subgroup.
Based on this conclusion henceforth the analysis will proceed with modified membership of the two subgrps as following:
- Subgrp1 (22): EOB_175,EOB_185,EOB_189,EOB_190,EOB_192,PBF_161,PBF_169,PBF_171,PBF_172,WOB_35,WOF_224,WOF_225, WOF_232, WOF_234,WOF_237,WOF_238,WOF_239,WOF_240,WOF_241,WOF_243,WOF_244,WOF_245.
- Subgrp2 (19): EOB_177,EOB_178,EOB_182,EOB_183,EOB_184,EOB_186,EOB_188,EOB_191, WOB_41,WOB_42,WOB_45,WOB_47,WOB_48,WOB_49,WOB_50,WOB_59,WOB_60,WOB_62,WOB_65.
Plots for outlier detection, PCA and MDS for full dataset and 2 subgrps that led to this conclusion are shown below.
Outlier detection:
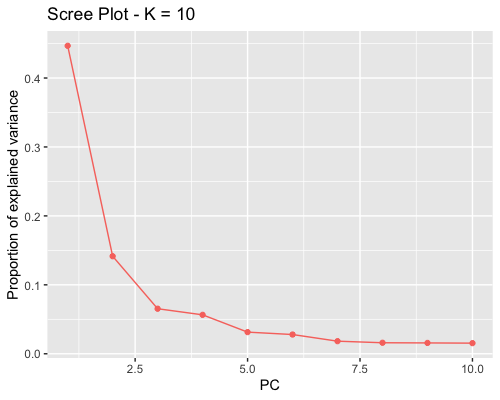
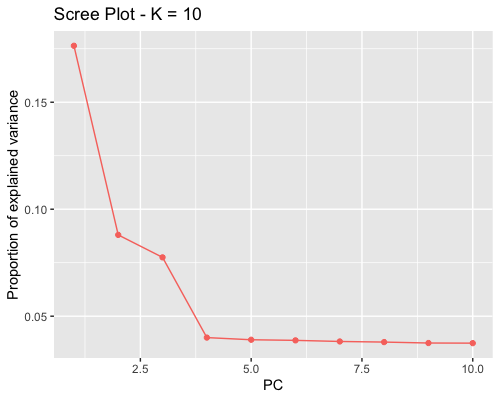
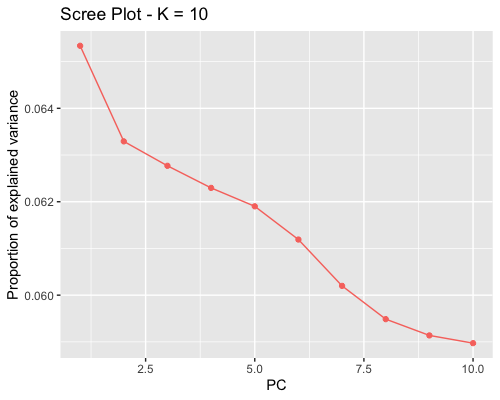
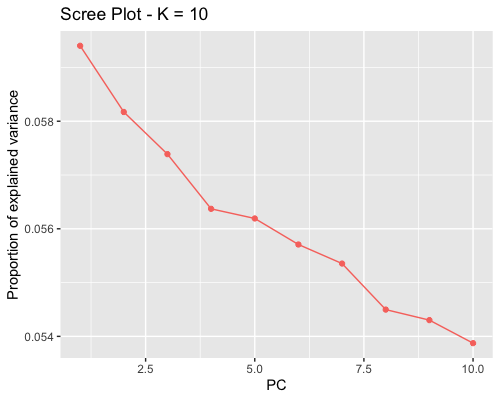
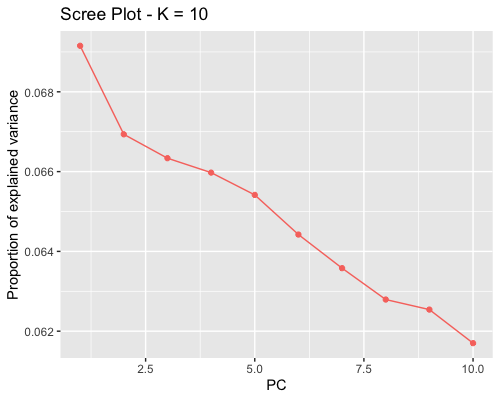
1. Choosing the number of principal components:
| full data |
subgrp1 |
subgrp2 |
 |
 |
 |
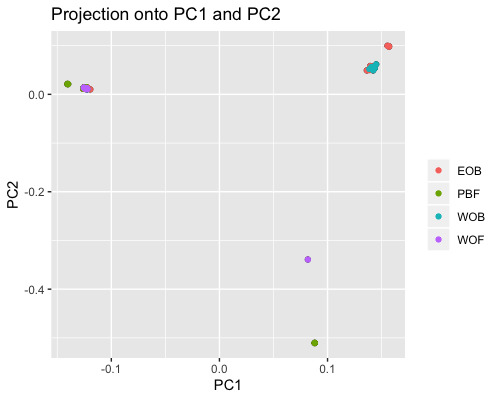
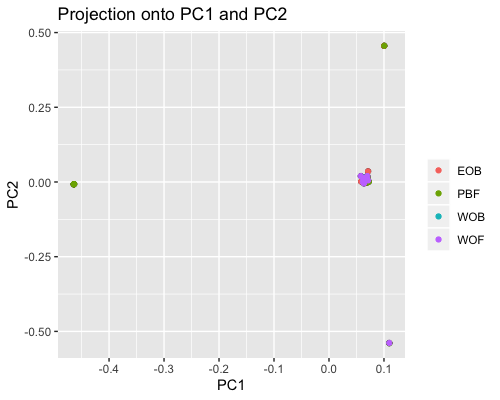
2. PCA based on scores:
| full data |
subgrp1 |
subgrp2 |
 |
 |
 |
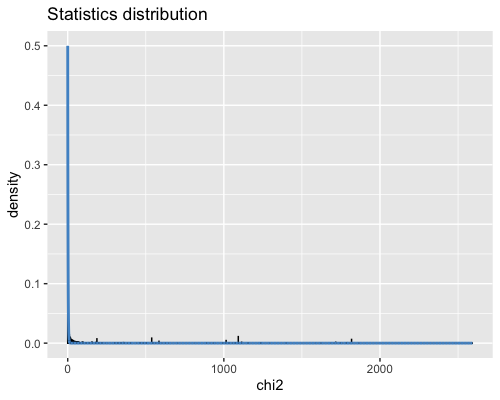
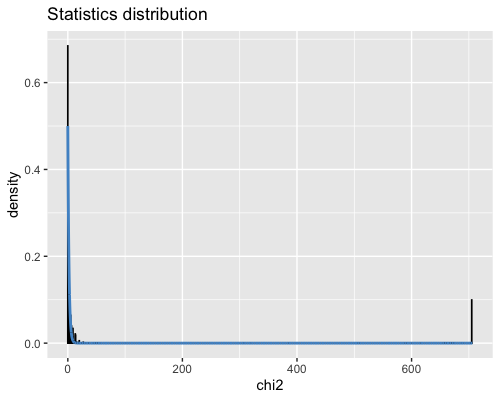
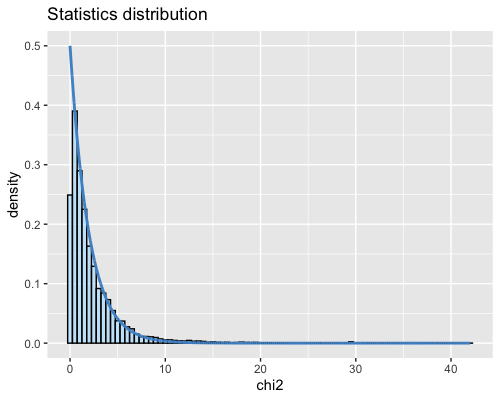
3. SNP distribution:
| full data |
subgrp1 |
subgrp2 |
 |
 |
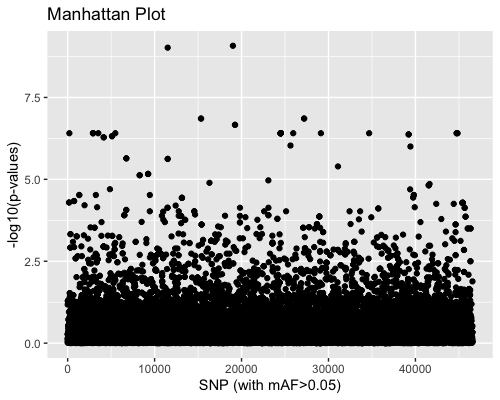 |
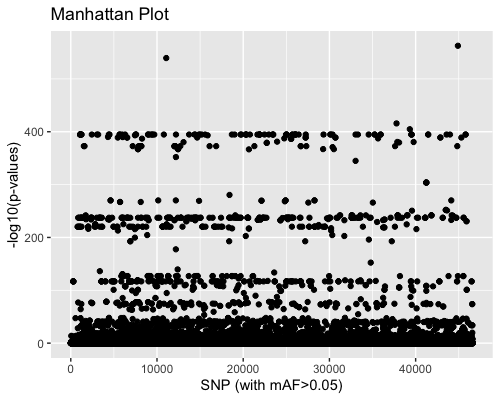
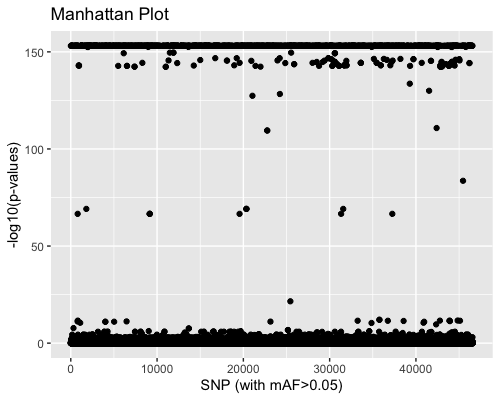
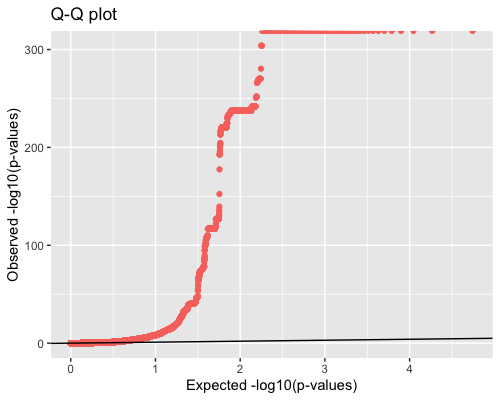
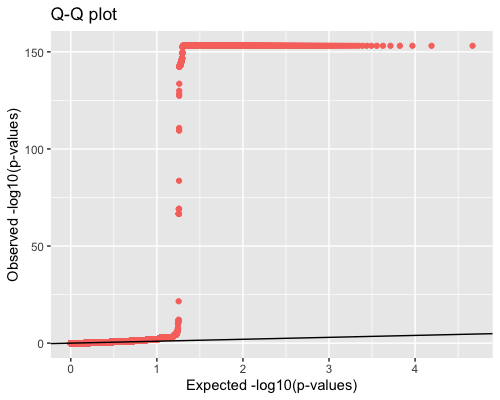
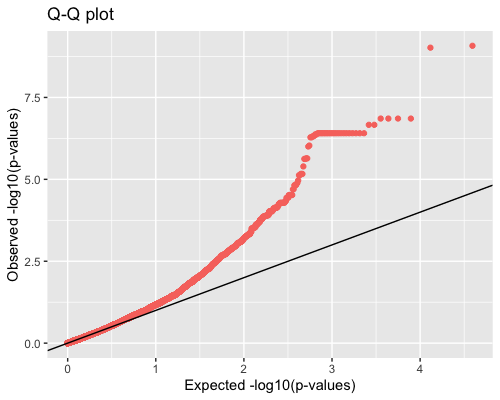
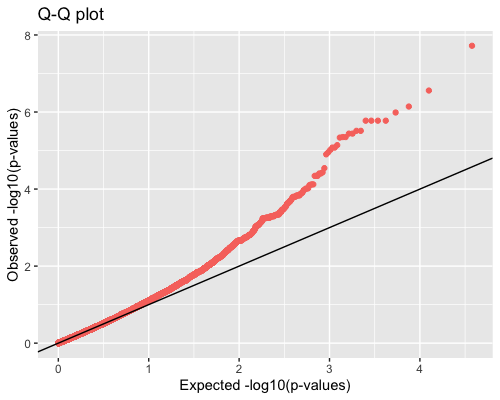
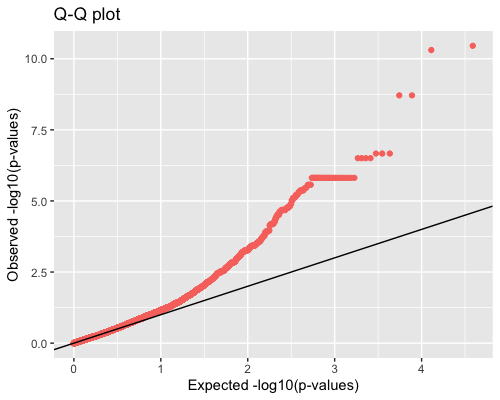
4. Distribution of pvalues:
| full data |
subgrp1 |
subgrp2 |
 |
 |
 |
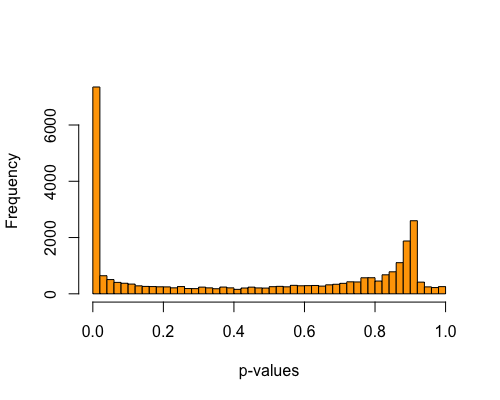
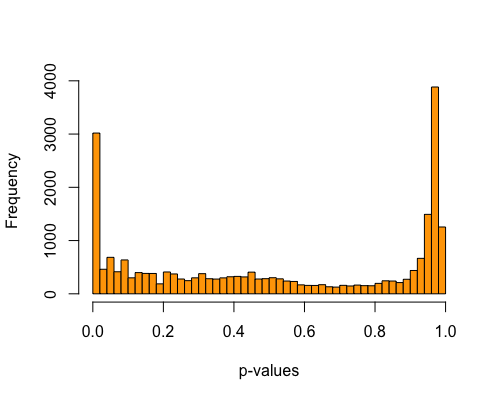
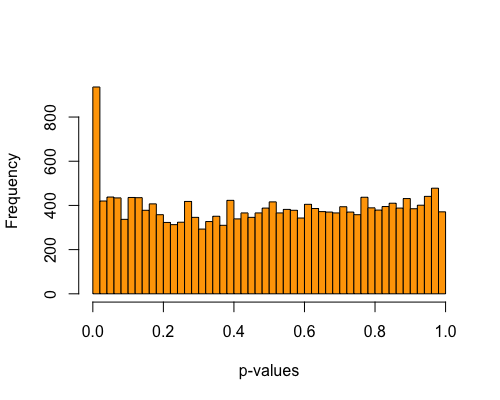
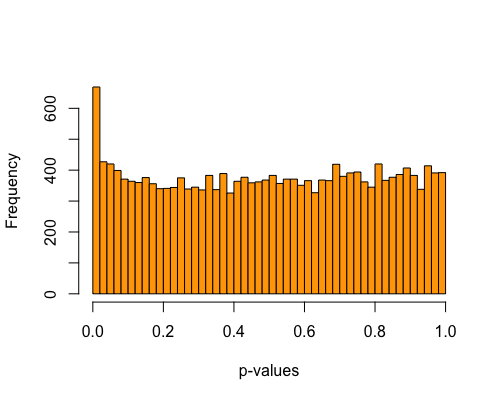
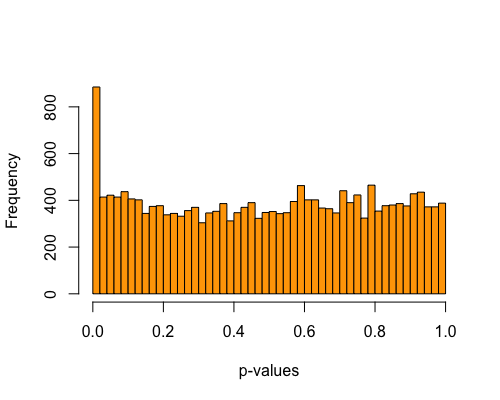
5. Histogram of pvalues:
| full data |
subgrp1 |
subgrp2 |
 |
 |
 |
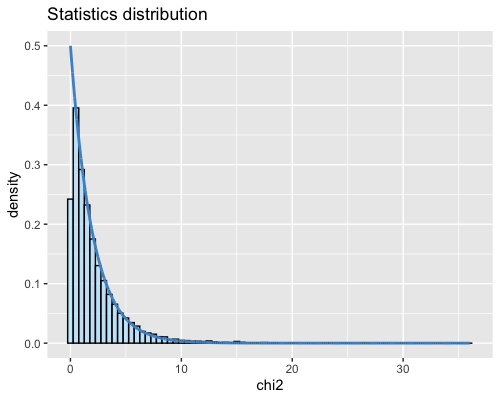
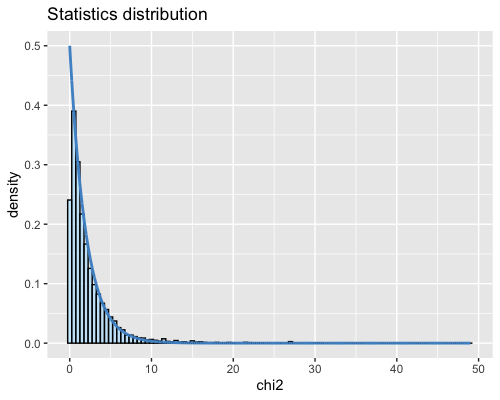
6. Histogram of the Mahalanobis distance:
| full data |
subgrp1 |
subgrp2 |
 |
 |
 |
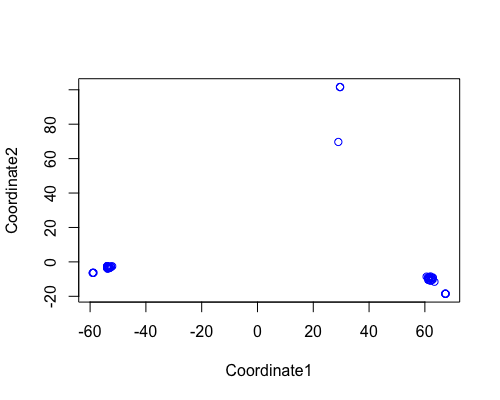
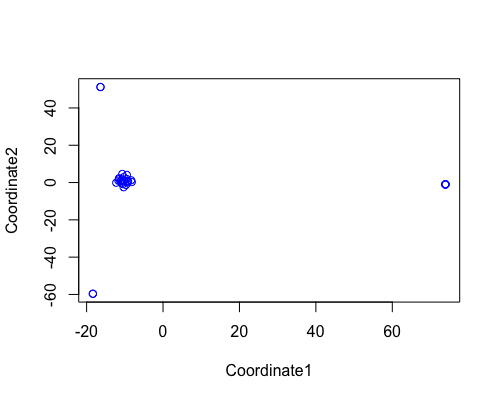
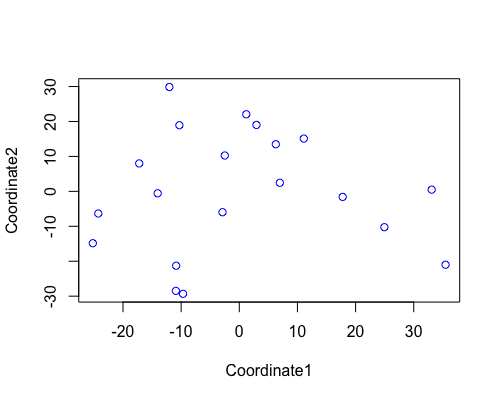
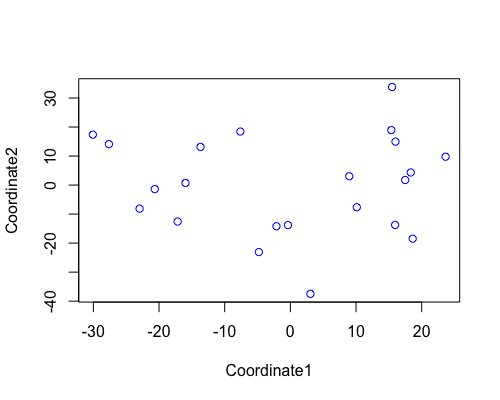
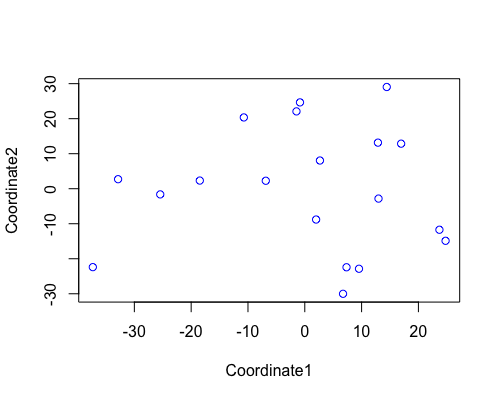
MDS
| full data |
subgrp1 |
subgrp2 |
 |
 |
 |
B. Comparison of results for NEW subgroups obtained by removing outliers from full data set as explained in the above section A.
- Subgrp1 (22): EOB_175,EOB_185,EOB_189,EOB_190,EOB_192,PBF_161,PBF_169,PBF_171,PBF_172,WOB_35,WOF_224,WOF_225, WOF_232, WOF_234,WOF_237,WOF_238,WOF_239,WOF_240,WOF_241,WOF_243,WOF_244,WOF_245.
- Subgrp2 (19): EOB_177,EOB_178,EOB_182,EOB_183,EOB_184,EOB_186,EOB_188,EOB_191, WOB_41,WOB_42,WOB_45,WOB_47,WOB_48,WOB_49,WOB_50,WOB_59,WOB_60,WOB_62,WOB_65.
Outlier detection:
1. Choosing the number of principal components:
| full data |
subgrp1 |
subgrp2 |
|
 |
 |
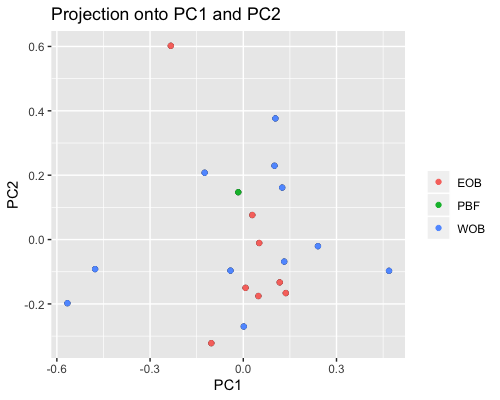
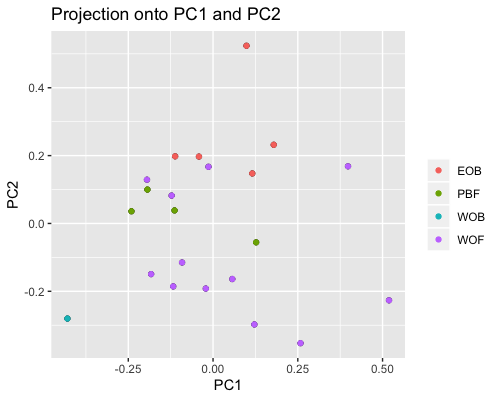
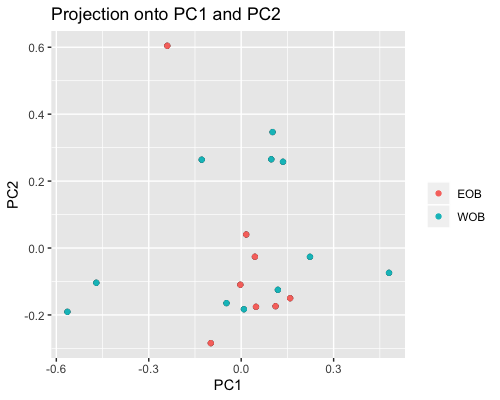
2. PCA based on scores:
PCA for subgroup1 shows samples from “fringe reef” form a fairly separate cluster than the “back reef” EOB or WOB samples. However we only have one WOB sample.
In subgroup2 EOB and WOB show separation with some overlap.
| full data |
subgrp1 |
subgrp2 |
|
 |
 |
3. SNP distribution:
| full data |
subgrp1 |
subgrp2 |
|
 |
 |
4. Distribution of pvalues:
| full data |
subgrp1 |
subgrp2 |
|
 |
 |
5. Histogram of pvalues:
| full data |
subgrp1 |
subgrp2 |
|
 |
 |
6. Histogram of the Mahalanobis distance:
| full data |
subgrp1 |
subgrp2 |
|
 |
 |
MDS
| full data |
subgrp1 |
subgrp2 |
|
 |
 |
FST
Pairwise FST
subgrp1| subgrp2
:————————-:|:——:
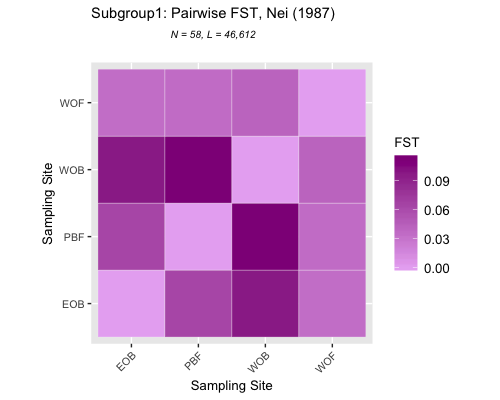 | EOB vs WOB 0.02949656
