
Comparison of results for filtered epiRAD data without outliers identified by DAPC
Comparison of results for the following data after adding an additional filter (Filter2b) for removing outlier samples identified by DAPC and rerunning the full epiRAD pipeline.
Number of individuals left after this additional filter is 33.
- Filter4: Data obtained post BLAST filter, low read filter and low coverage filter
- Filter 5a: Data obtained post filter4 AND removing problematic loci identified by rad_haplotyper
- Filter 5b: Data obtained post filter4 AND keeping only those loci that remain after full SNP filtering pipeline
| Filter# | Number of loci | Methylation cutoff |
|---|---|---|
| 4 | 7795 | -2.848 |
| 5a | 6809 | -2.883959 |
| 5b | 5912 | -2.830382 |
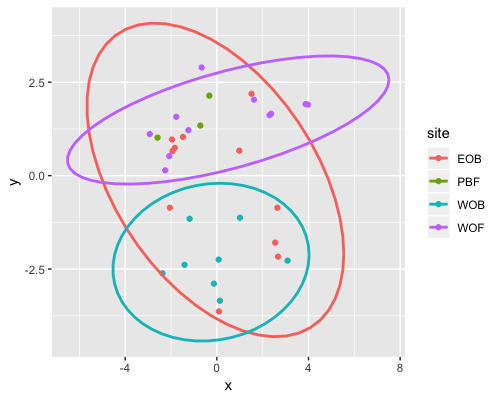
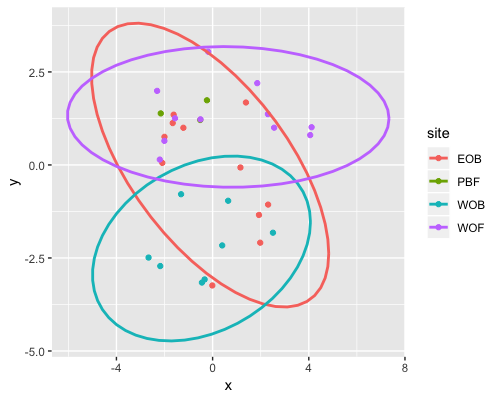
Result1: MDS without dapc outliers
| Filter4 | Filter5a | Filter5b |
|---|---|---|
 |
 |
 |
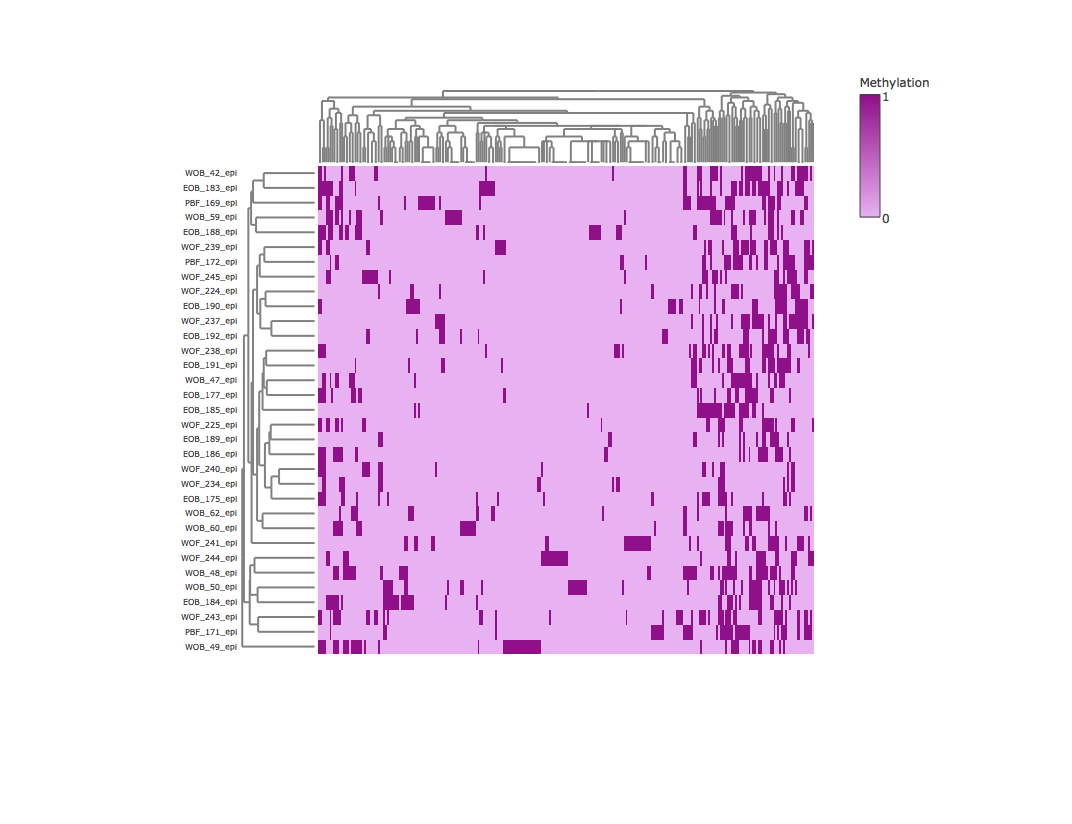
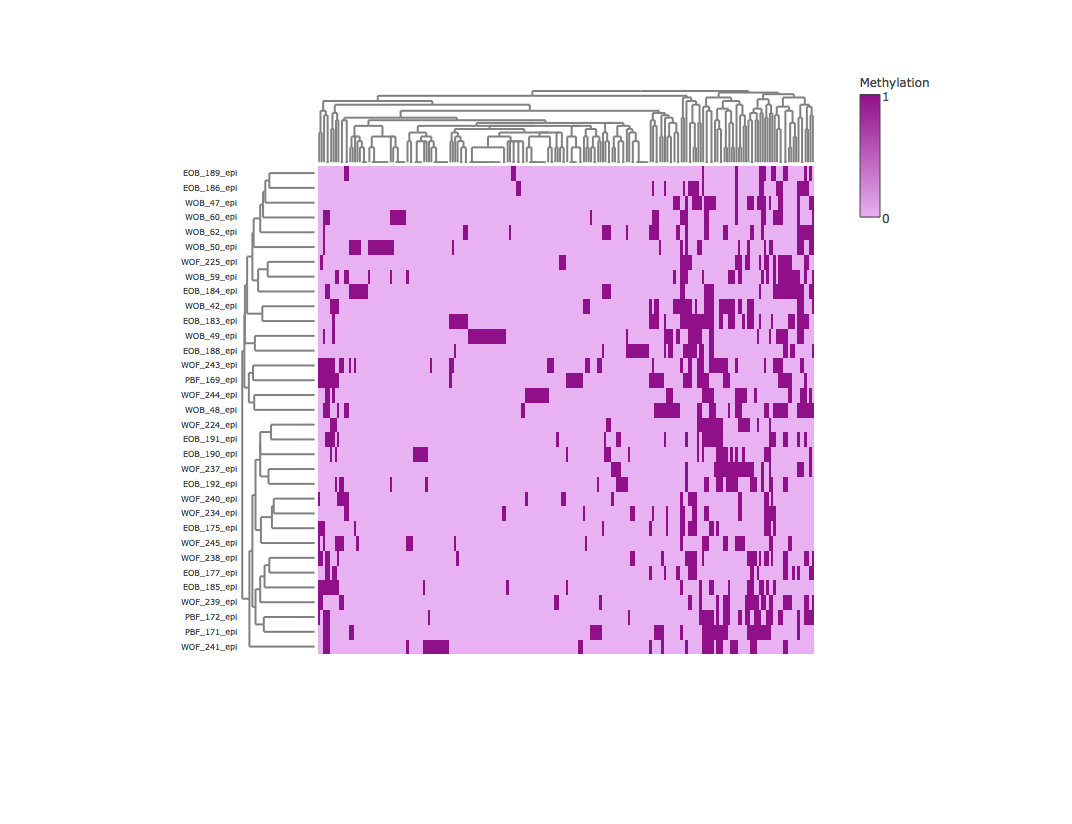
Result2: Methylation heatmap clustered by rows and columns without dapc outliers
| Filter4 | Filter5a | Filter5b |
|---|---|---|
 |
 |
 |
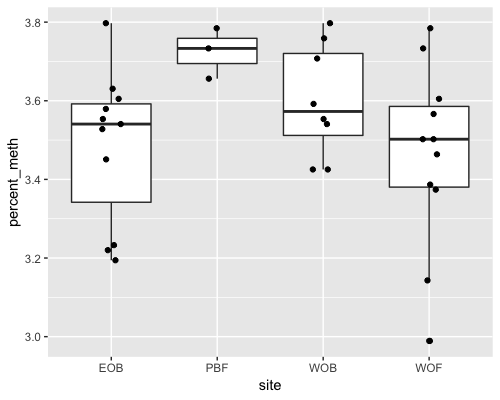
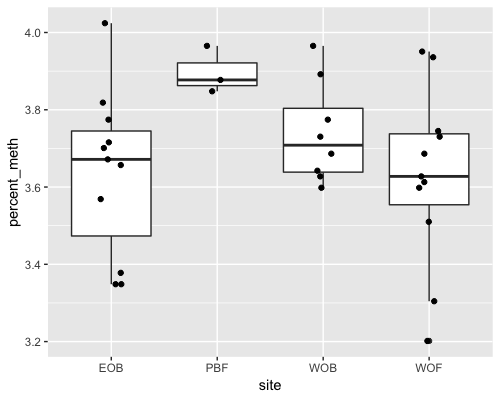
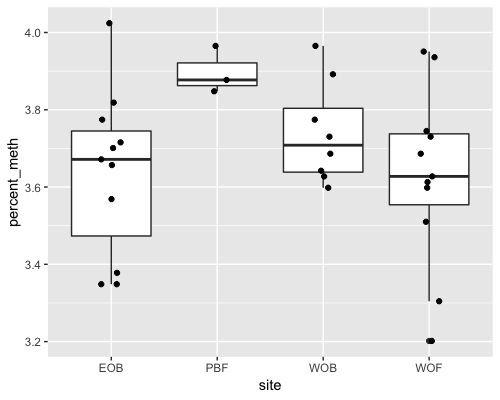
Result3: %Methylation without dapc outliers
ANOVA for % methylation per site is not significant.
| Filter4 | Filter5a | Filter5b |
|---|---|---|
 |
 |
 |
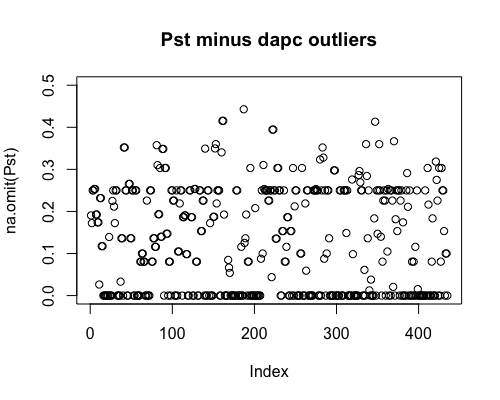
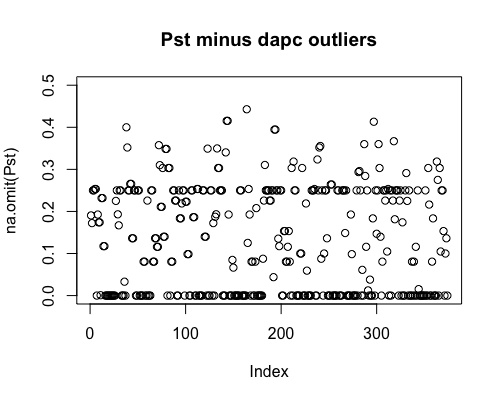
Result5a: Pst
| Filter4 | Filter5a | Filter5b | |
|---|---|---|---|
| Mean Pst | 0.127 | 0.132 | 0.132 |
| Filter4 | Filter5a | Filter5b |
|---|---|---|
 |
 |
 |
Result5b: Pairwise Pst
| Table 1 Filter4 | Table 2 Filter5a | Table3 Filter5b |
|---|---|---|
| | | EOB | PBF | WOB | WOF | |-----|-----|-------|-------|-------| | EOB | x | 0.217 | 0.053 | 0.02 | | PBF | | x | 0.2 | 0.218 | | WOB | | | x | 0.072 | | WOF | | | | x | | | | EOB | PBF | WOB | WOF | |-----|-----|-------|-------|-------| | EOB | x | 0.22 | 0.055 | 0.018 | | PBF | | x | 0.199 | 0.219 | | WOB | | | x | 0.075 | | WOF | | | | x | | | | EOB | PBF | WOB | WOF | |-----|-----|-------|-------|-------| | EOB | x | 0.22 | 0.055 | 0.018 | | PBF | | x | 0.199 | 0.219 | | WOB | | | x | 0.075 | | WOF | | | | x | |
Result5c: Pooled Back Reef vs Pooled Fringe Reef Pst
| Filter4 | Filter5a | Filter5b | |
|---|---|---|---|
| Mean Pst | 0.053 | 0.053 | 0.053 |
find.clusters
find.clusters identifies one cluster for data post Filter4,5a,5b.
PERMANOVA
by site
| Filter4 | Filter5a | Filter5b | |
|---|---|---|---|
| R2 | 0.12809 | 0.12993 | 0.12993 |
| Pvalue | 0.011 | 0.011 | 0.007 |
by loc
| Filter4 | Filter5a | Filter5b | |
|---|---|---|---|
| R2 | 0.06397 | 0.06215 | 0.6215 |
| Pvalue | 0.001 | 0.002 | 0.003 |
Written on July 16, 2020