
Comparison of results for filtered epiRAD data without outliers
Comparison of results for the following data after removing outlier samples
- Filter4: Data obtained post BLAST filter, low read filter and low coverage filter
- Filter 5a: Data obtained post filter4 AND removing problematic loci identified by rad_haplotyper
- Filter 5b: Data obtained post filter4 AND keeping only those loci that remain after full SNP filtering pipeline
Outliers removed: PBF_158, WOF_232, WOF_236 and WOB_41.
| Filter# | Number of loci | Methylation cutoff |
|---|---|---|
| 4 | 7006 | -2.822 |
| 5a | 6101 | -2.863801 |
| 5b | 5579 | -2.870767 |
Result1: MDS without outliers
| Filter4 | Filter5a | Filter5b |
|---|---|---|
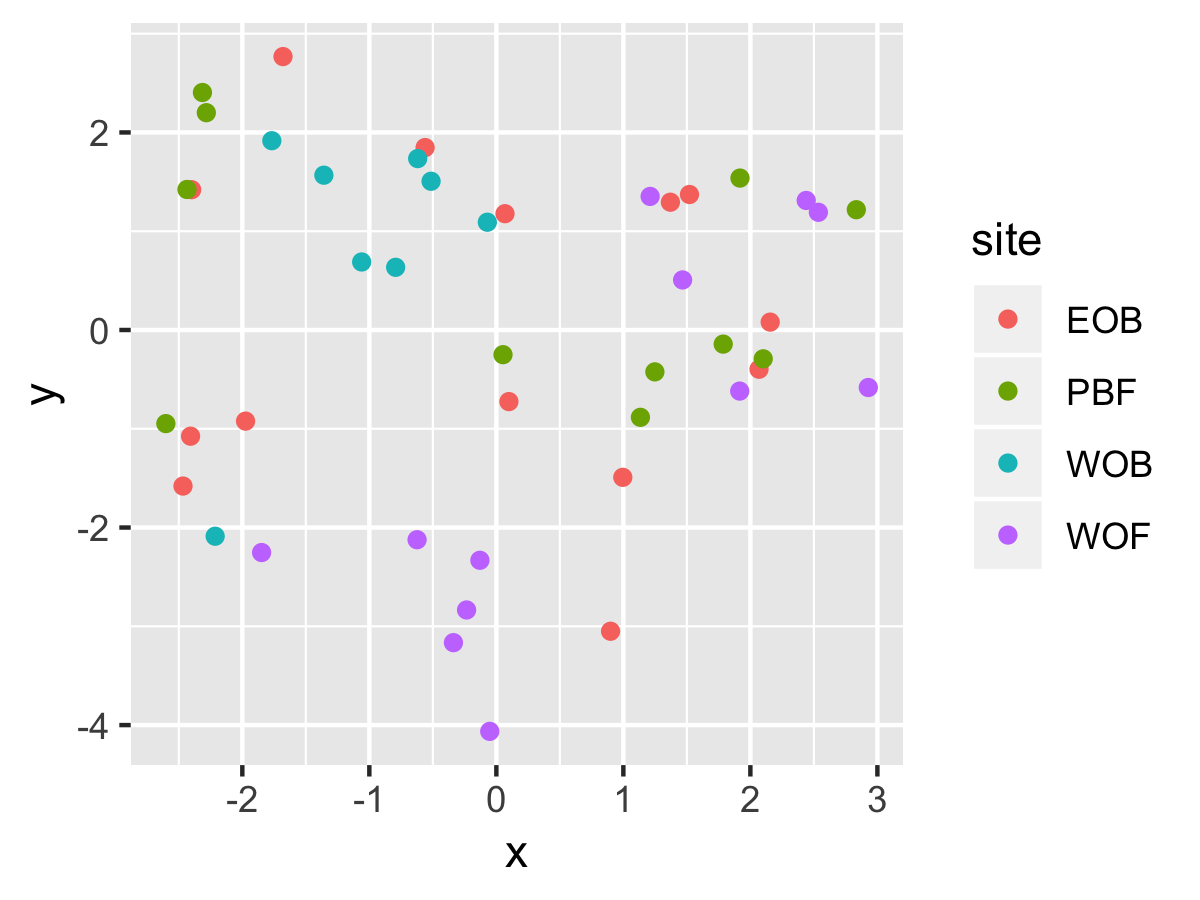 |
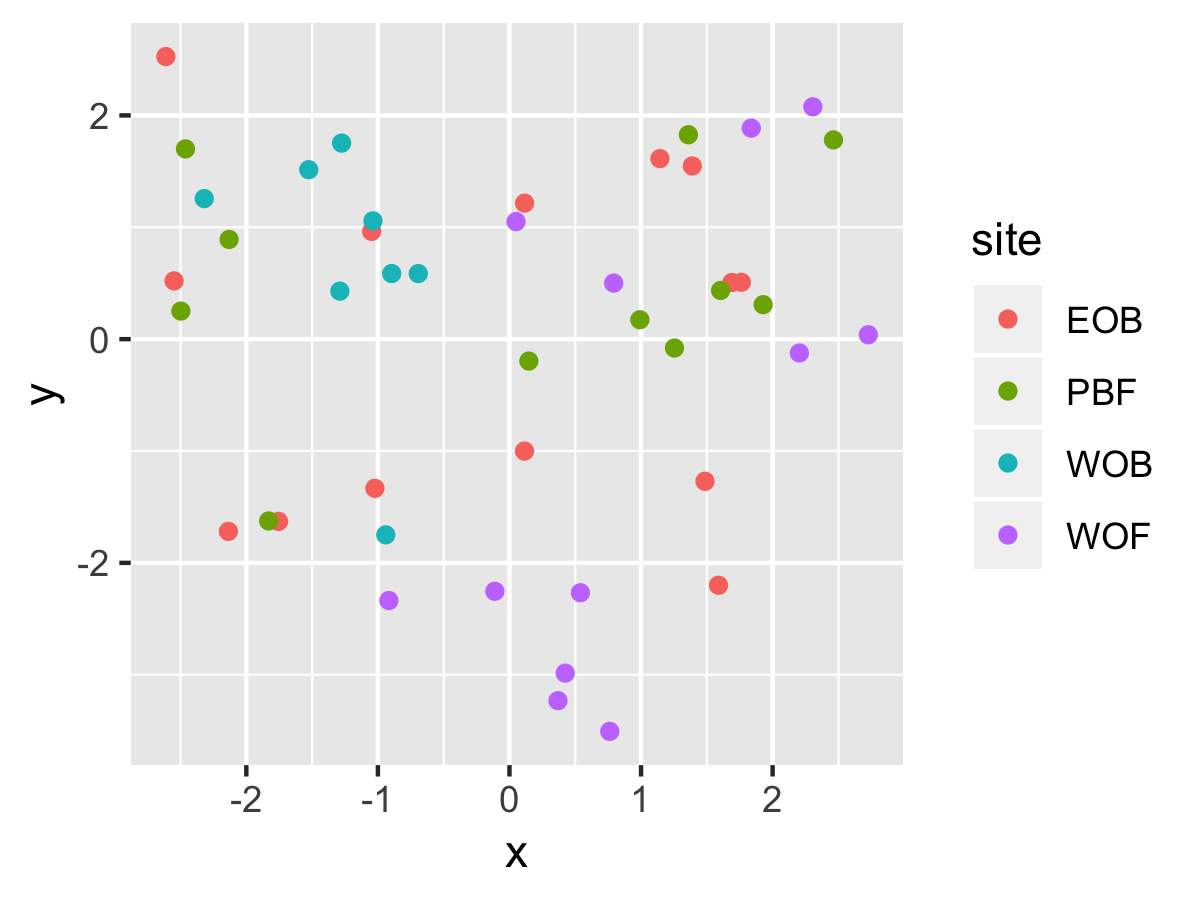 |
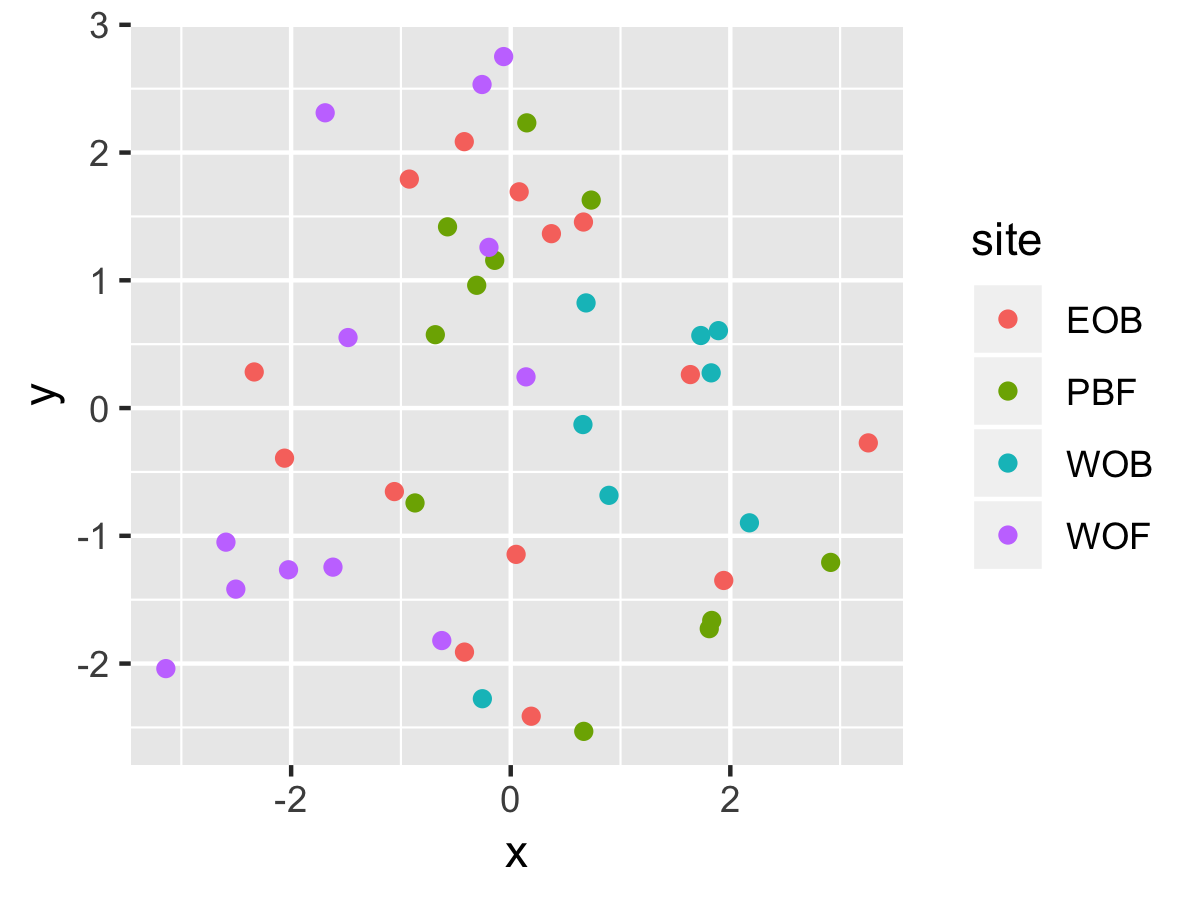 |
Result2: Methylation heatmap clustered by rows and columns without outliers
| Filter4 | Filter5a | Filter5b |
|---|---|---|
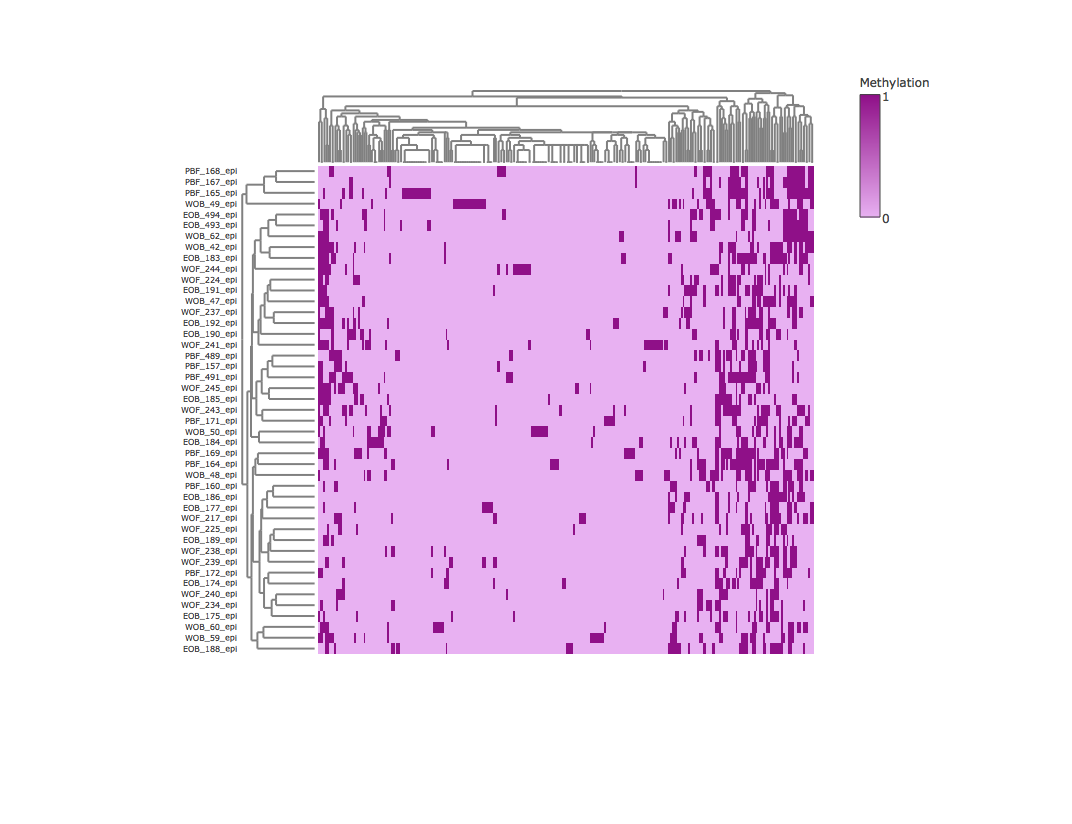 |
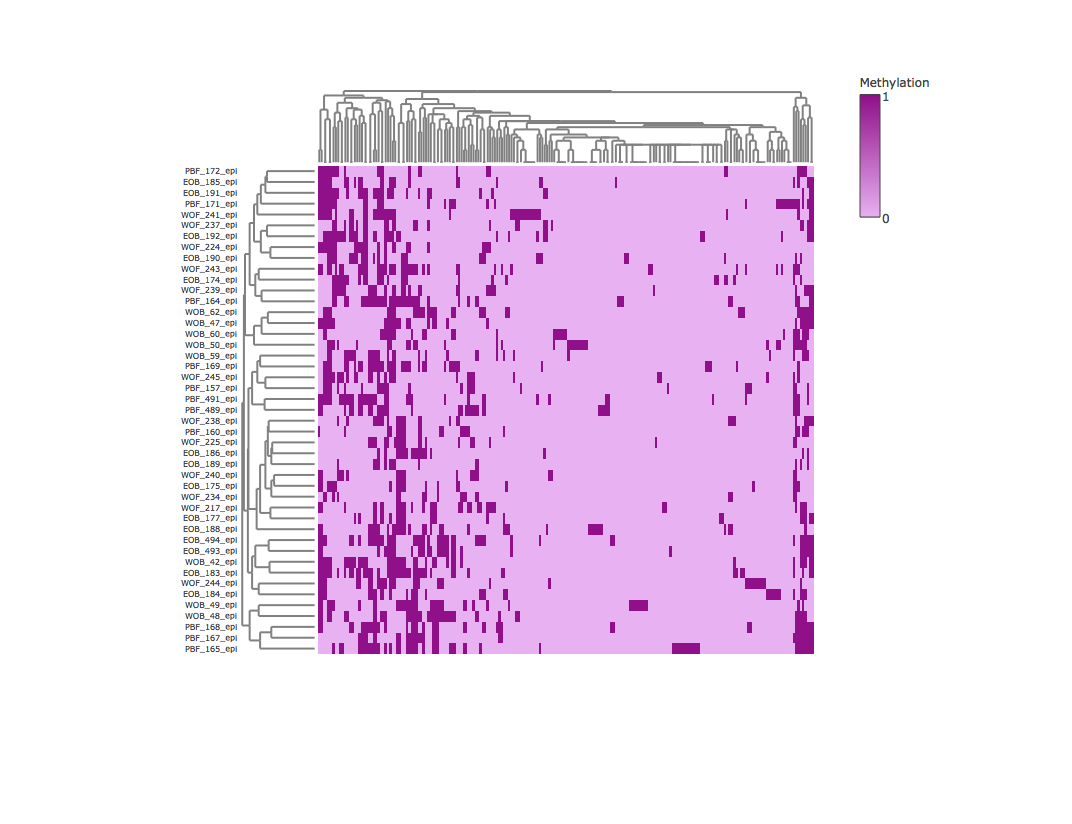 |
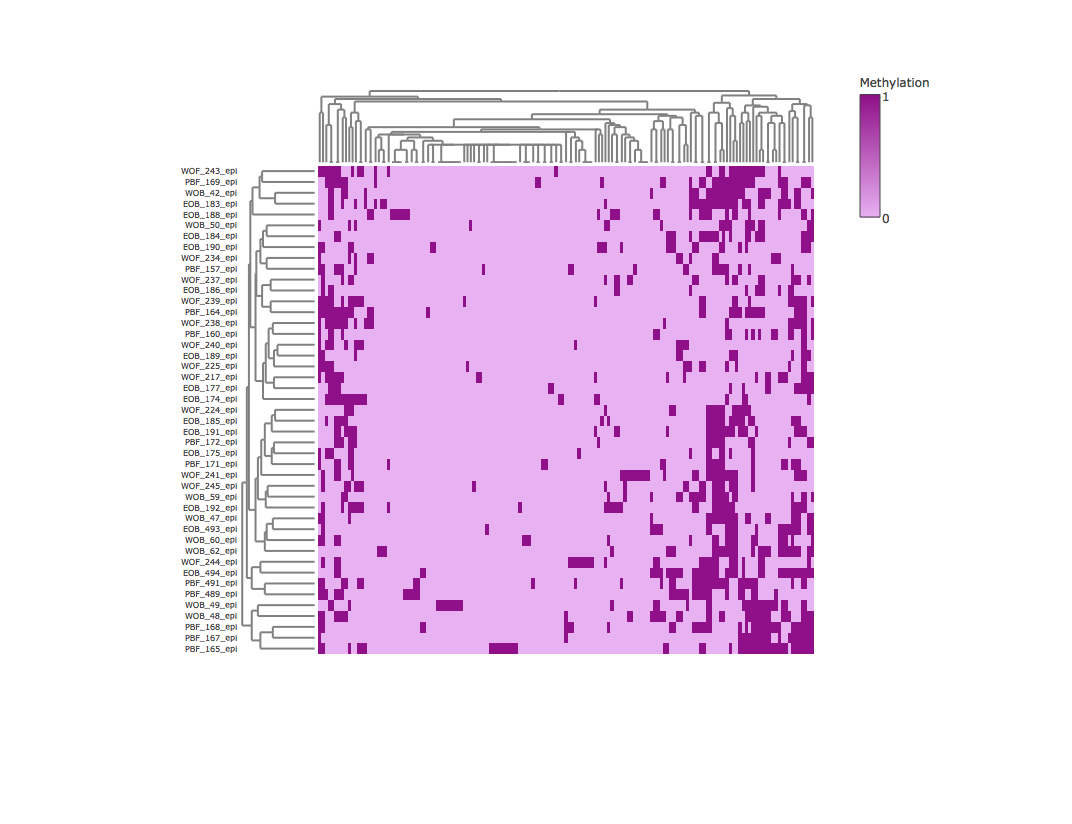 |
Result3: %Methylation without outliers
| Filter4 | Filter5a | Filter5b |
|---|---|---|
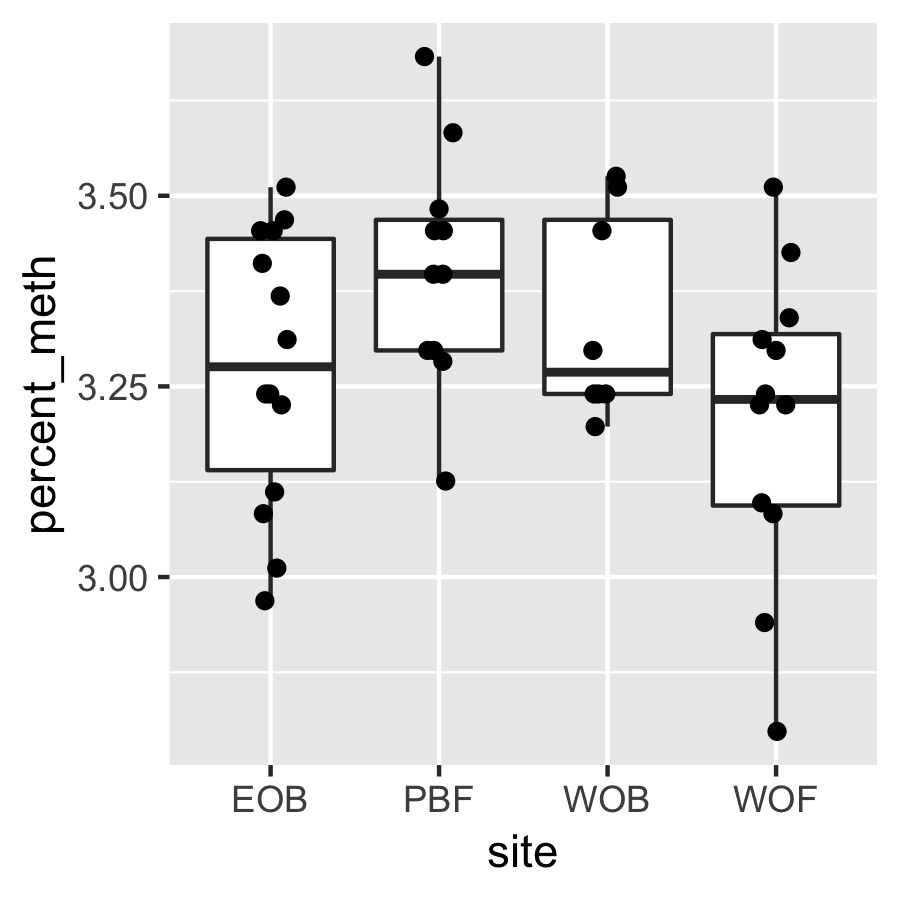 |
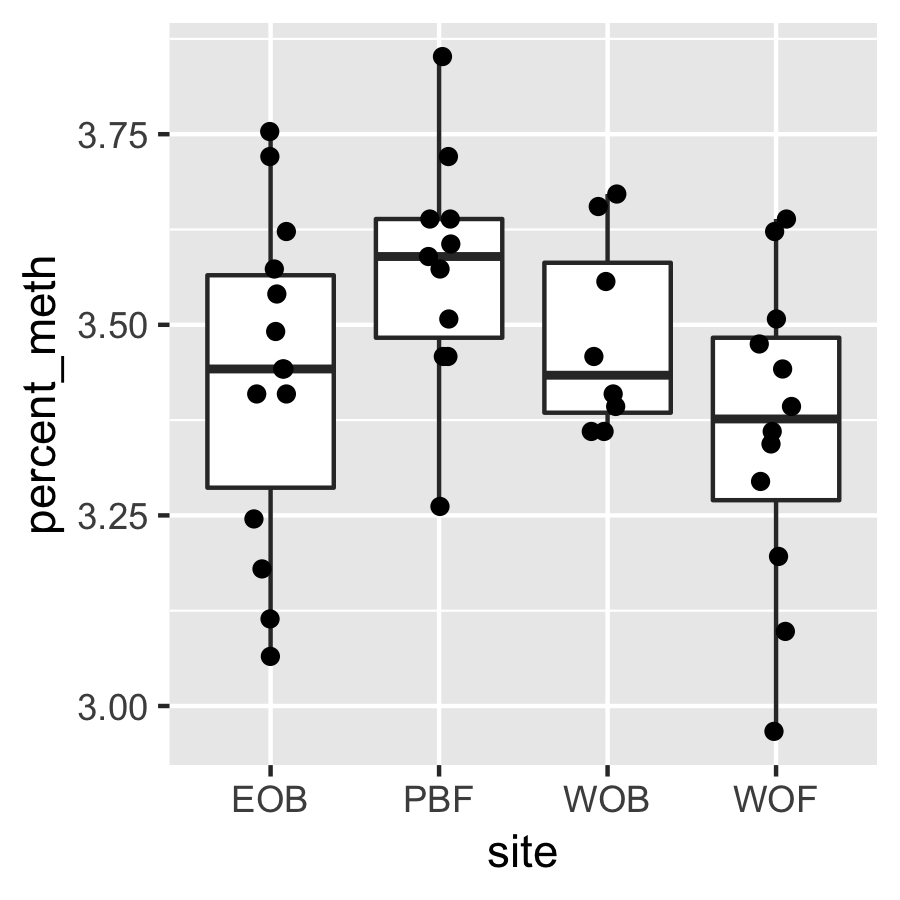 |
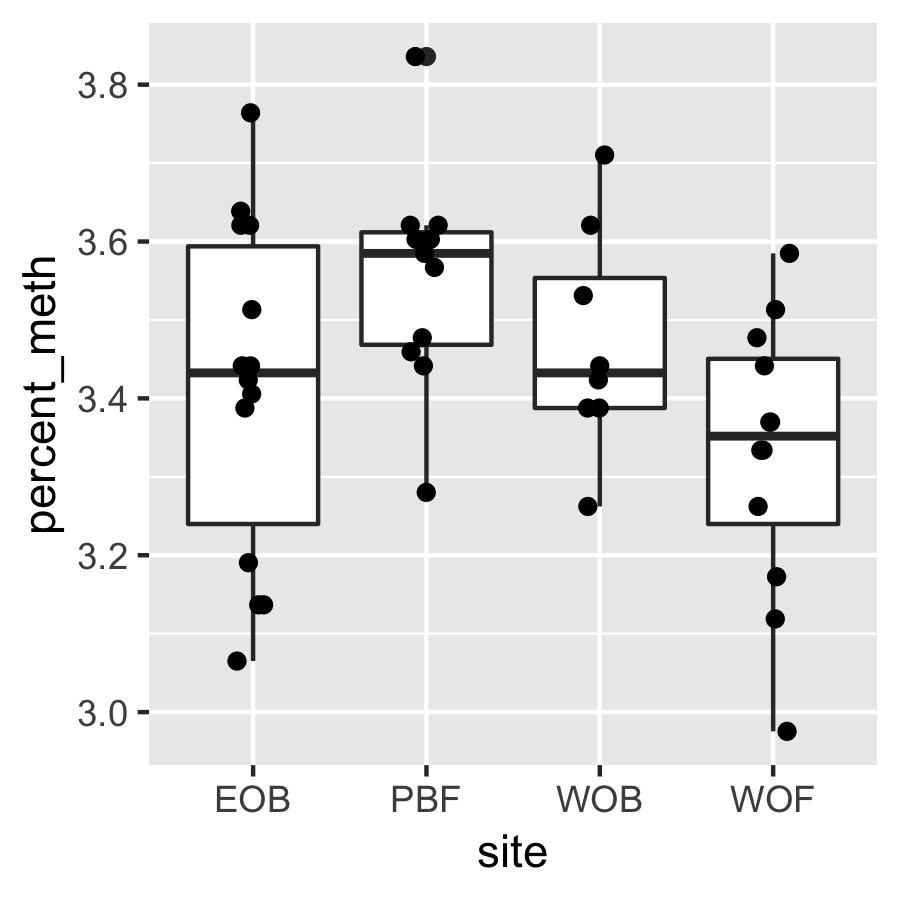 |
Result5a: Pst
| Filter4 | Filter5a | Filter5b | |
|---|---|---|---|
| Mean Pst | 0.054 | 0.059 | 0.061 |
| Filter4 | Filter5a | Filter5b |
|---|---|---|
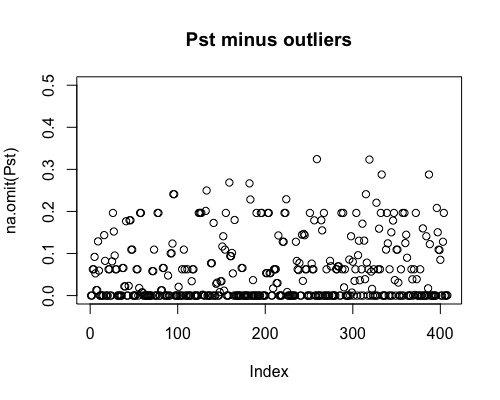 |
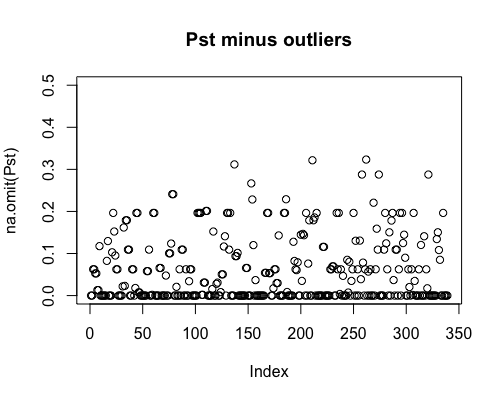 |
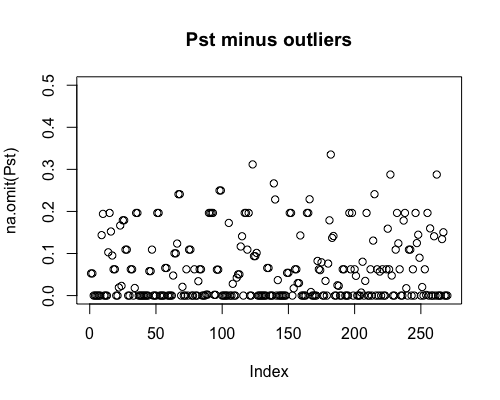 |
Result5b: Pairwise Pst
| Table 1 Filter4 | Table 2 Filter5a | Table3 Filter5b | |||||||||||||||||||||||||||||||||||||||||||||||||||||||||||||||||||||||||||
|---|---|---|---|---|---|---|---|---|---|---|---|---|---|---|---|---|---|---|---|---|---|---|---|---|---|---|---|---|---|---|---|---|---|---|---|---|---|---|---|---|---|---|---|---|---|---|---|---|---|---|---|---|---|---|---|---|---|---|---|---|---|---|---|---|---|---|---|---|---|---|---|---|---|---|---|---|---|
|
|
|
Result5c: Pooled Back Reef vs Pooled Fringe Reef Pst
| Filter4 | Filter5a | Filter5b | |
|---|---|---|---|
| Mean Pst | 0.017 | 0.017 | 0.016 |
Written on June 25, 2020